Quick Start
Joule is part of the Wattsworth software stack. Follow the instructions on Installation to setup both Joule and Lumen
. Before continuing make sure the Lumen site is available on http://127.0.0.1 and that the jouled service is running:
# ensure the joule CLI is installed
$> joule --version
joule, version 0.10.X
# ensure the joule daemon (jouled) is running
$> sudo systemctl status joule.service
The first time you use the Joule client you will need to authorize your account. This requires admin privileges, subsequent
users can be added without admin privileges using the add user command. See authorize for more details. Note this
may take some time to complete if you have just installed the system as the Docker containers need to be initialized.
# authorize local user access to joule server
$> sudo -E joule admin authorize
Access to node [xxxx] granted to user [xxxx]
# confirm connection to joule server
$> joule node info
Server Version: 0.10.X
Status: online
This guide will step through the implementation of the three stage pipeline shown below:

The Data Source
The first module is a data reader. Reader modules "read" data into the
Joule pipeline. This data can come from embedded sensors, HTTP API's,
system logs, or any other timeseries data source.
Our reader will simply produce random values. Joule provides a
built-in module specifically for this purpose. Stubbing pipeline
inputs with a random data source can simplify unit testing and expose
logic errors. See the Module Documentation page
for more details on this and other Joule modules.
Try out joule-random-reader on the command line:
$> joule-random-reader -h
# ... module documentation (available at http://docs.wattsworth.net/modules)
$> joule-random-reader --width 2 --rate 10
1485188853650944 0.32359053067687582 0.70028608966895545
1485188853750944 0.72139550945715136 0.39218791387411422
1485188853850944 0.40728044378612194 0.26446072057019654
1485188853950944 0.61021957330250398 0.27359526775709841
# output continues, hit ctrl-c to stop
When a reader module is run from the command line its output stream is sent
to standard output (the screen). Now let's add this module to our pipeline. We need to create a Module Configuration file
to tell Joule how to execute the module and where
to connect its output. To do this create the following file:
: /etc/joule/module_configs/data_source.conf
[Main]
exec_cmd = joule-random-reader
name = Data Source
[Arguments]
width = 2
rate = 10
[Outputs]
output = /demo/random:float32[x,y]
This connects the module to the stream /demo/random. The stream is configured
inline after the colon (:). This specifies a float32 datatype and two elements named
x and y. To control other stream options create a DataStream Configuration file
in /etc/joule/stream_configs. Now the pipeline is ready to execute. Restart joule and check that the
new module is running:
# restart joule to use the new configuration files
$> sudo service joule restart
# check pipeline status using the joule CLI
$> joule module list -s
╒═════════════╤══════════╤══════════════╤═════════╤═════════════╕
│ Name │ Inputs │ Outputs │ CPU % │ Mem % │
╞═════════════╪══════════╪══════════════╪═════════╪═════════════╡
│ Data Source │ │ /demo/random │ 0 │ 2 │
╘═════════════╧══════════╧══════════════╧═════════╧═════════════╛
# check module logs for any errors
$> joule module logs "Data Source"
[2018-09-12T15:51:38.845242]: ---starting module---
# confirm the pipeline is producing data
$> joule stream info /demo/random -e
Name: random
Description: —
Datatype: float32
Keep: all data
Decimate: yes
Status: ● [active]
Start: 2018-09-12 15:51:39.811572
End: 2018-09-12 15:52:59.711573
Rows: 800
╒════════╤═════════╤════════════╤═══════════╕
│ Name │ Units │ Display │ Min,Max │
╞════════╪═════════╪════════════╪═══════════╡
│ x │ — │ continuous │ auto │
├────────┼─────────┼────────────┼───────────┤
│ y │ — │ continuous │ auto │
╘════════╧═════════╧════════════╧═══════════╛
# view live data stream
$> joule data read -l /demo/random
1485188853650944 0.32359053067687582 0.70028608966895545
1485188853750944 0.72139550945715136 0.39218791387411422
1485188853850944 0.40728044378612194 0.26446072057019654
1485188853950944 0.61021957330250398 0.27359526775709841
# output continues, hit ctrl-c to stop
The Data Processor
Now let's add a filter to smooth out the random data produced by the
reader. Joule provides a built-in moving average filter, mean,
that does exactly this. See the Module Documentation page
for more details on this and other Joule modules.
Joule filters can execute as standalone programs but require extra
configuration to do so because they can have multiple inputs and
outputs. For now let's just run it in the Joule environment. To add
the module to the pipeline create the following file:
: /etc/joule/module_configs/data_processor.conf
[Main]
exec_cmd = joule-mean-filter
name = Data Processor
[Arguments]
window = 11
[Inputs]
input = /demo/random
[Outputs]
output = /demo/smoothed:float32[x,y]
The input stream is already configured by the producer module. The output will have the same
datatype and number of elements. Now the pipeline is fully configured. Restart joule and check that
both modules are running:
# restart joule to use the new configuration files
$> sudo service joule restart
# check pipeline status using the joule CLI
$> joule module list -s
╒════════════════╤══════════════╤════════════════╤═════════╤═════════════╕
│ Name │ Inputs │ Outputs │ CPU % │ Mem % │
╞════════════════╪══════════════╪════════════════╪═════════╪═════════════╡
│ Data Processor │ /demo/random │ /demo/smoothed │ 0 │ 2 │
├────────────────┼──────────────┼────────────────┼─────────┼─────────────┤
│ Data Source │ │ /demo/random │ 0 │ 2 │
╘════════════════╧══════════════╧════════════════╧═════════╧═════════════╛
$> joule module logs "Data Processor"
[2018-09-12T16:00:34.298364]: ---starting module---
# confirm the pipeline is producing data (check /demo/random as well)
$> joule stream info /demo/smoothed -e
Name: smoothed
Description: —
Datatype: float32
Keep: all data
Decimate: yes
Status: ● [active]
Start: 2018-09-12 16:00:35.788668
End: 2018-09-12 16:02:29.688669
Rows: 1140
╒════════╤═════════╤════════════╤═══════════╕
│ Name │ Units │ Display │ Min,Max │
╞════════╪═════════╪════════════╪═══════════╡
│ x │ — │ continuous │ auto │
├────────┼─────────┼────────────┼───────────┤
│ y │ — │ continuous │ auto │
╘════════╧═════════╧════════════╧═══════════╛
The Data App
Finally let's add a Data App to complete our pipeline with a user interface. Joule provides a simple built-in
module to visualize recent values and historic highs and lows of stream elements.
See the Module Documentation page for more details on the visualizer
and other Joule modules.
Add the following file to the configuration directory to add the
module to the pipeline.
: /etc/joule/module_configs/data_app.conf
[Main]
exec_cmd = joule-visualizer-filter
name = Data App
is_app = yes
[Arguments]
title = Quick Start Data Pipeline
[Inputs]
smoothed = /demo/smoothed
random = /demo/random
Restart Joule and confirm that the new module is active
# restart joule to use the new configuration files
$> sudo service joule restart
# check pipeline status using the joule CLI
$> joule module list -s
╒════════════════╤════════════════╤════════════════╤═════════╤═════════════╕
│ Name │ Inputs │ Outputs │ CPU % │ Mem % │
╞════════════════╪════════════════╪════════════════╪═════════╪═════════════╡
│ Data Processor │ /demo/random │ /demo/smoothed │ 2 │ 2 │
├────────────────┼────────────────┼────────────────┼─────────┼─────────────┤
│ Data App │ /demo/smoothed │ │ 0 │ 2 │
│ │ /demo/random │ │ │ │
├────────────────┼────────────────┼────────────────┼─────────┼─────────────┤
│ Data Source │ │ /demo/random │ 0 │ 2 │
╘════════════════╧════════════════╧════════════════╧═════════╧═════════════╛
# check the module info to find the interface URL
$> joule module info "Data App"
--connecting to [joule_node]--
This is module is a Data App
Name:
Data App
Inputs:
smoothed: /demo/smoothed
random: /demo/random
Outputs:
--none--
CPU Usage:
0.00%
Memory Usage:
3.95%
Uptime:
0:18:25.660176
Lumen Setup
Data Apps can be accessed through the Lumen webserver. First, link Joule to the
local Lumen server using the command below. Note if the Lumen server is
already activated you will need an authorization key to add additional Joule
nodes.
# connect joule to the local lumen server
$> joule master add lumen 127.0.0.1
# ...follow prompts to create a user account
Now open a browser and point it to http://127.0.0.1 if you are on the
target machine or use the IP address of the machine if you want to access
it from another device. Log in with the user credentials you just added.
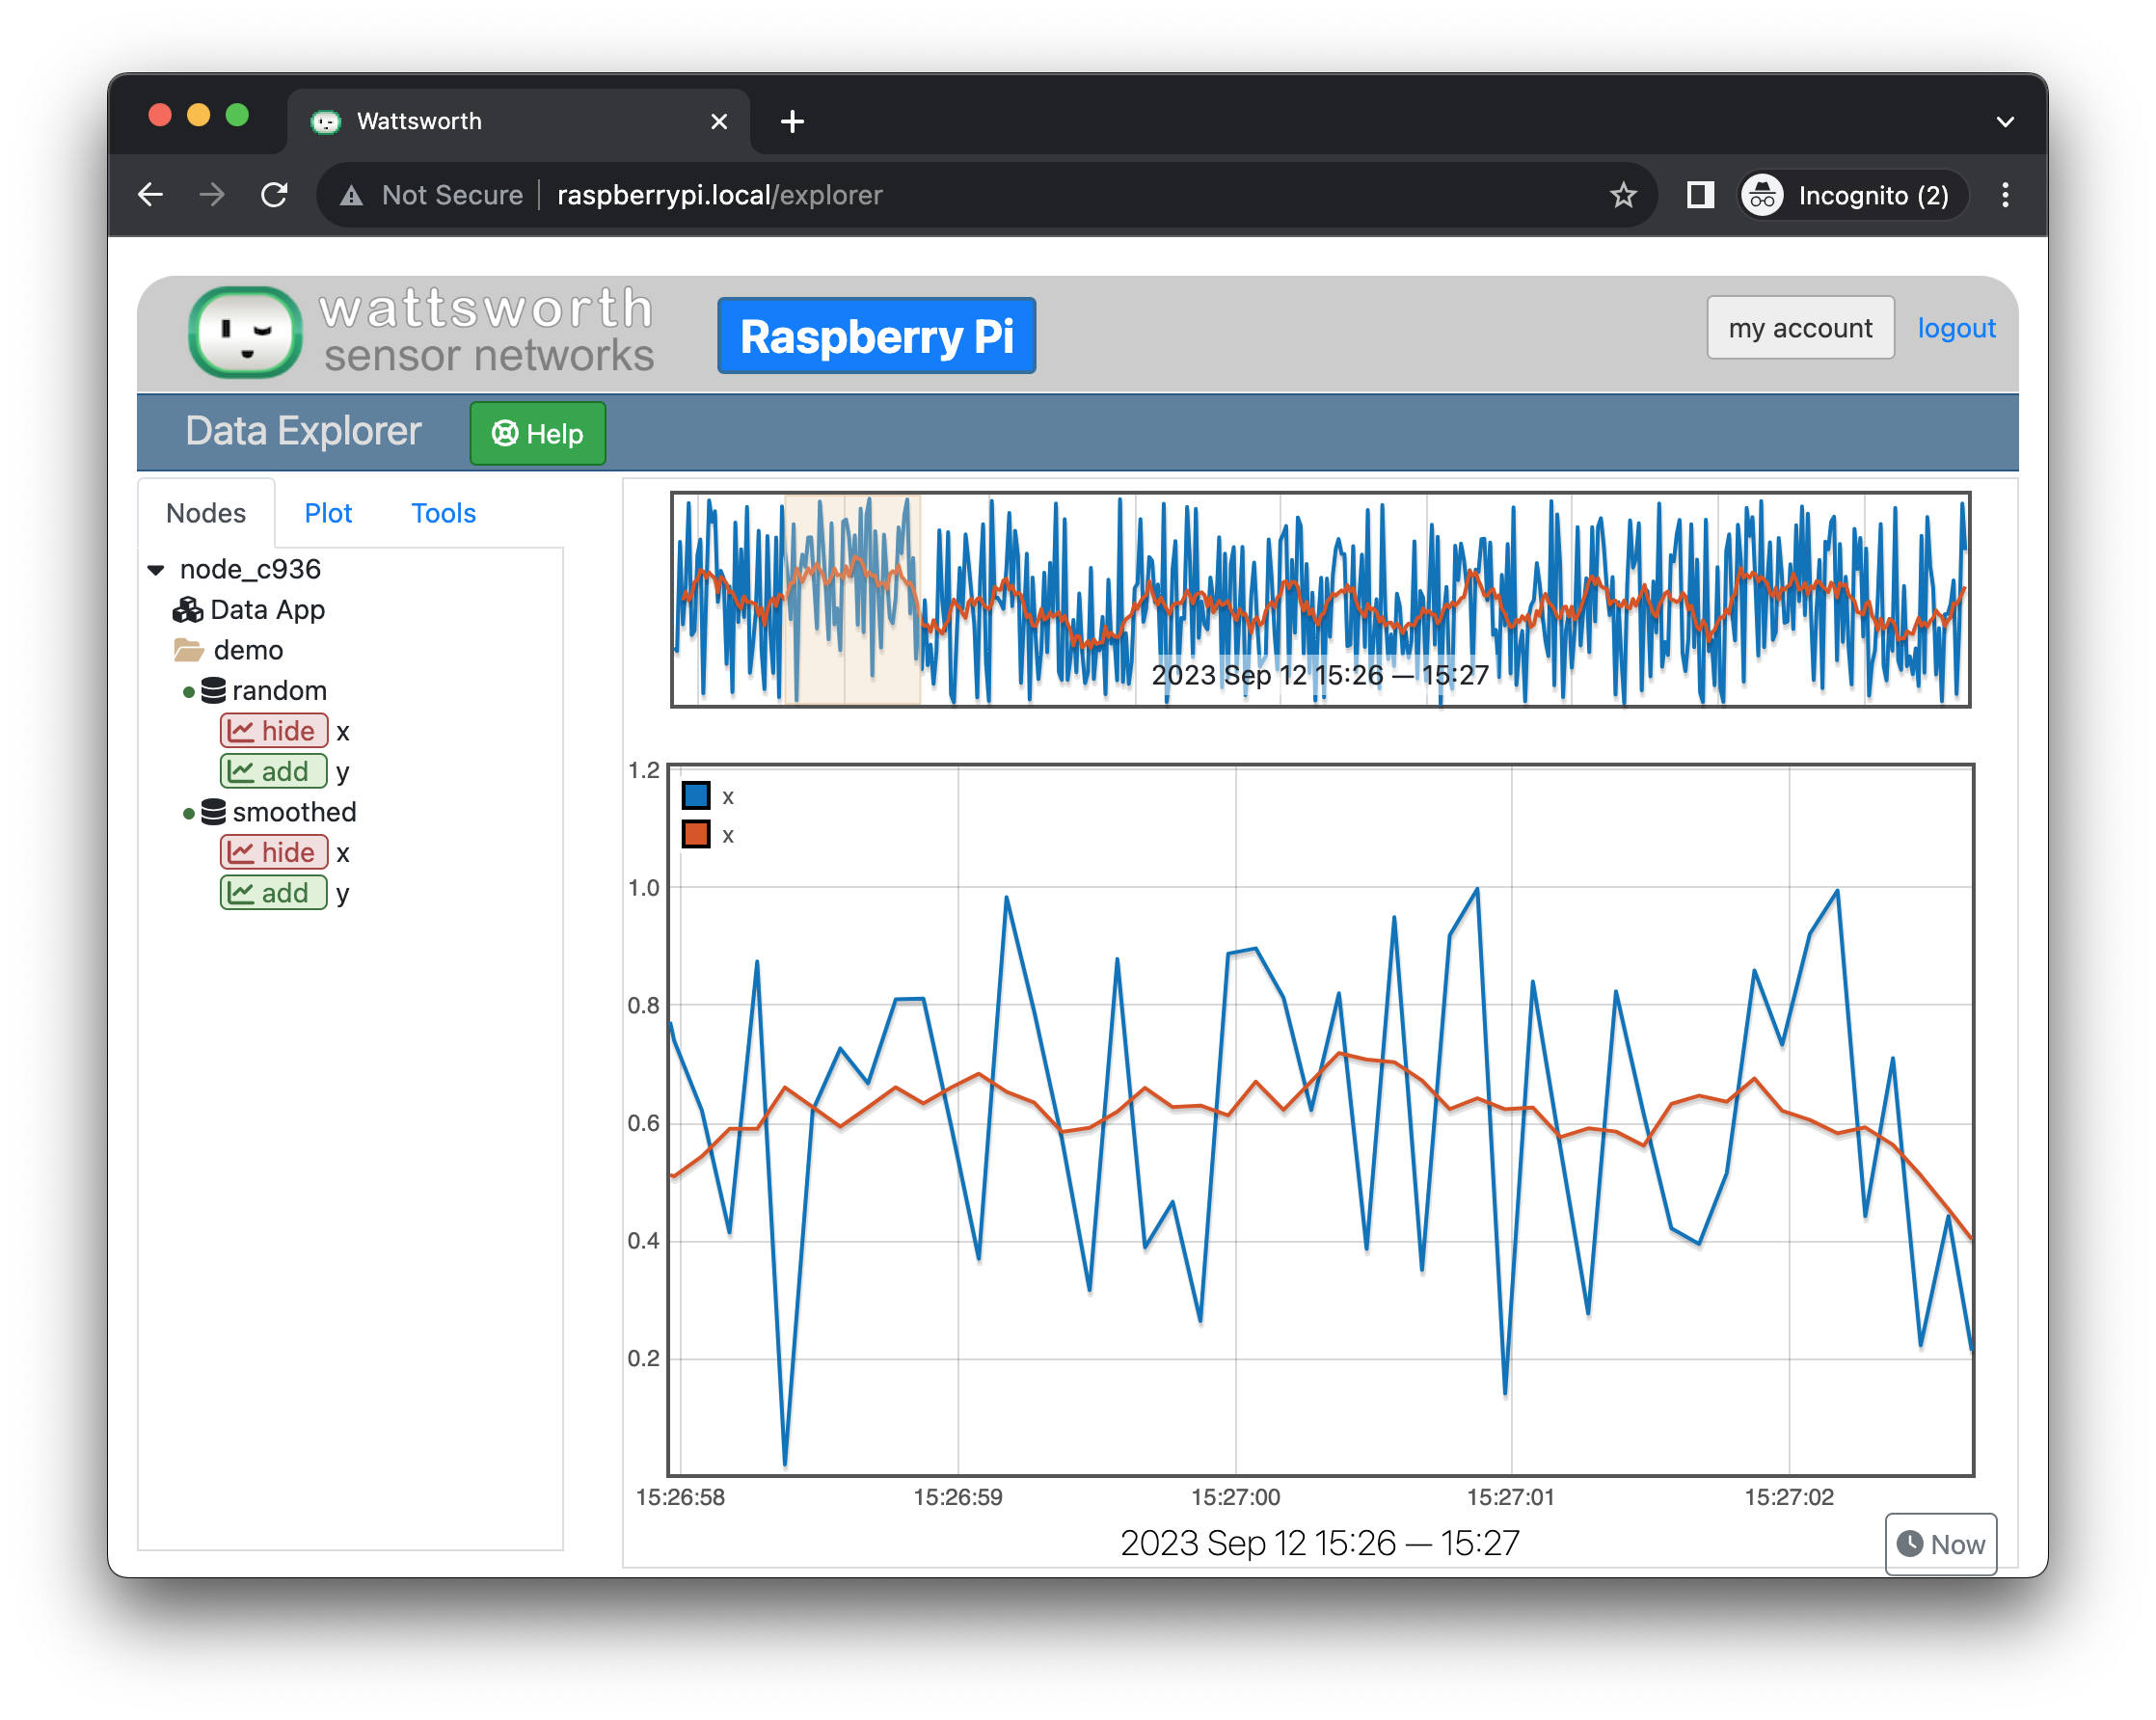
From the main page, expand the local Joule node (node_c936 below). If you
followed this guide and do not see all of the streams below hover the cursor
over the node name and click the refresh icon. Click on the folders and data streams
to expand them and click the add button next to elements
to add them to the plot.
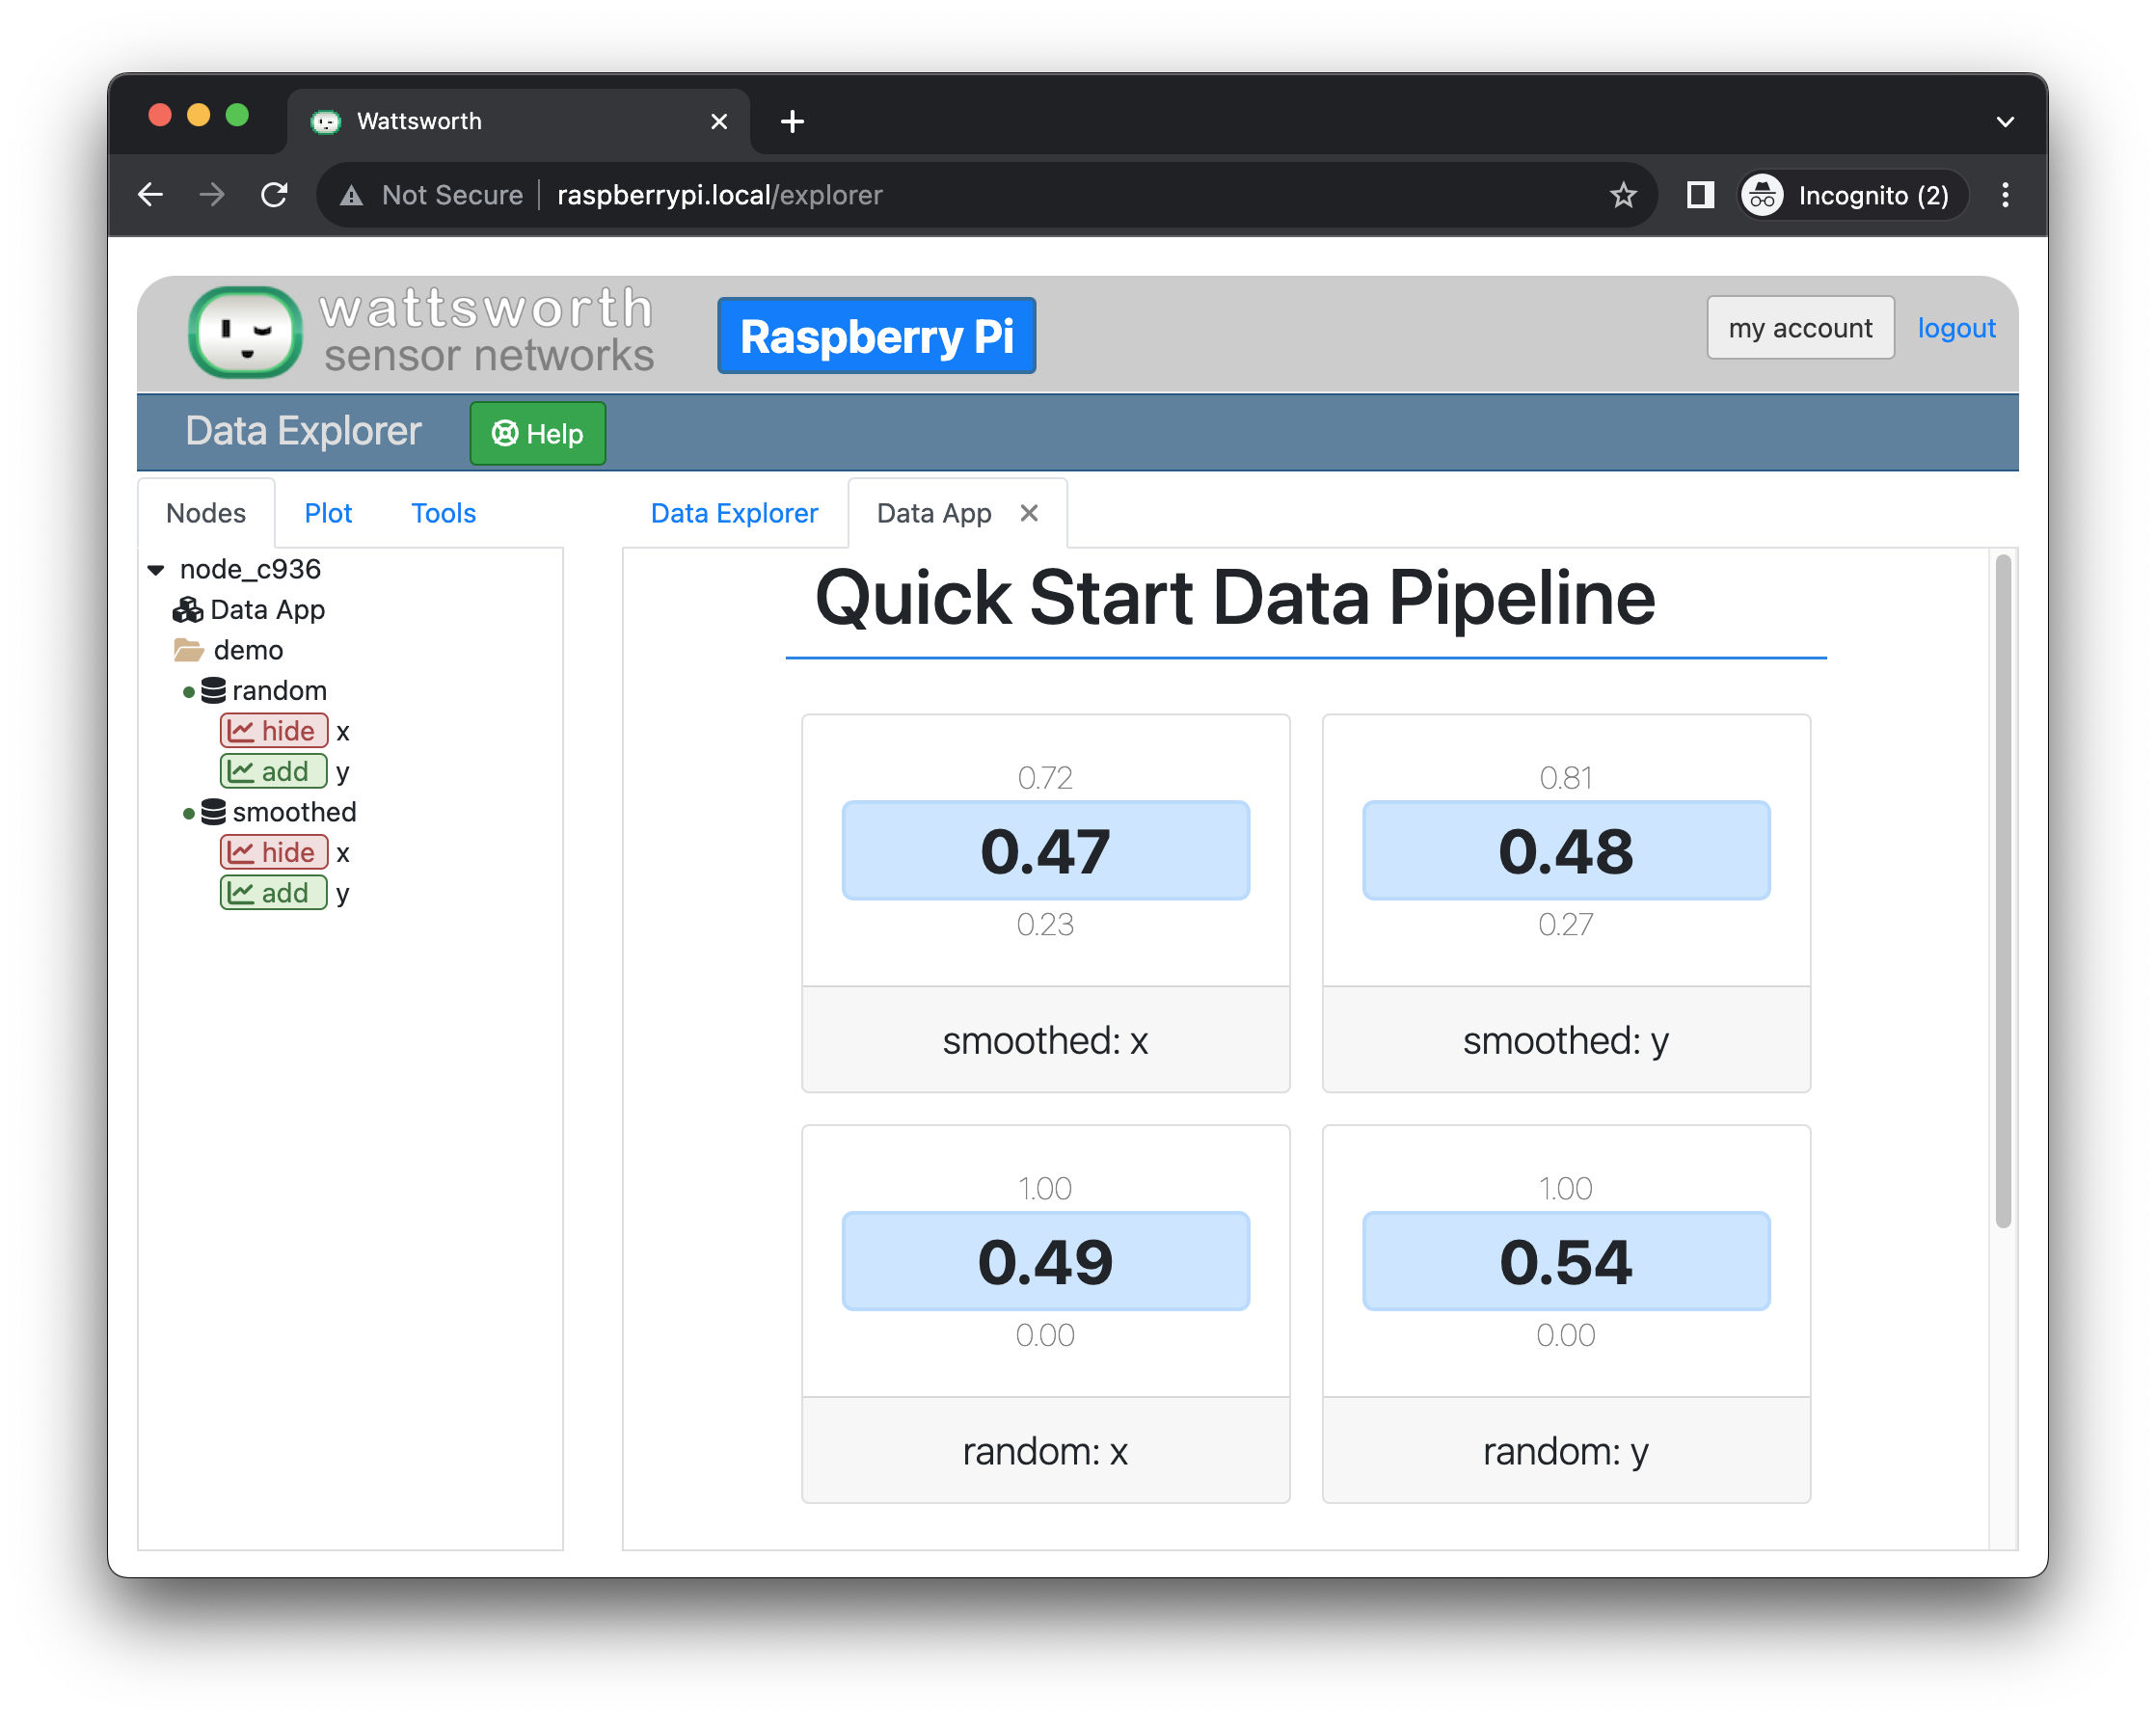
The data app can be opened within the interface as a tab (shown below) or run in a new
window by clicking the popout icon next to the app name.
See Lumen for additional details on using the web interface.