Data Explorer
Main Plot
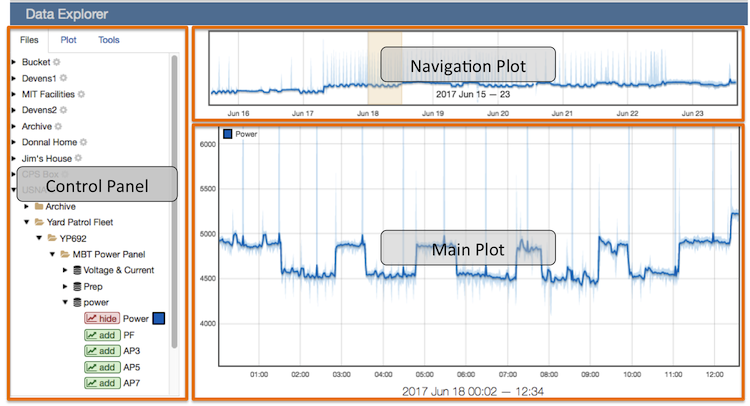
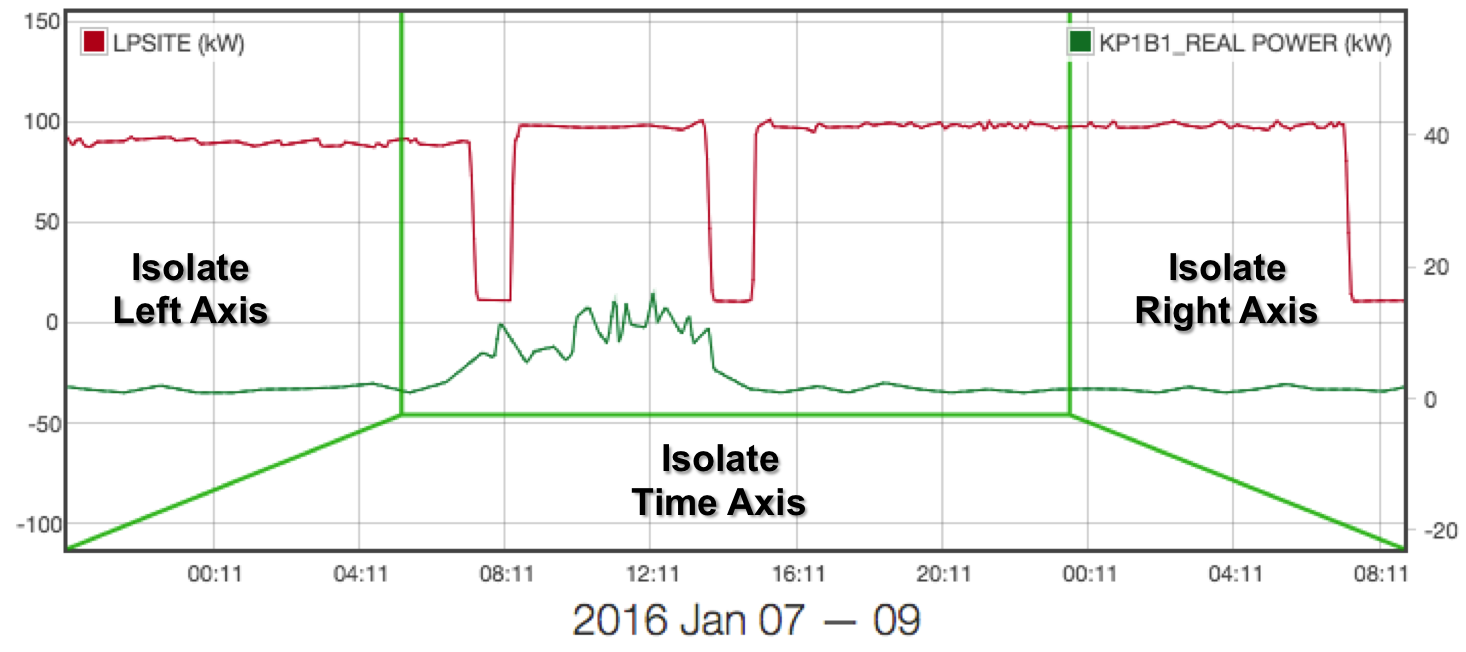
The Main Plot interface supports pan and zoom on three axes (left-y, right-y and time). Click and drag to pan. Scroll or double click to zoom. The plot is divided into four regions as shown in the figure below. The zoom and pan controls operate differently depending on the cursor location.
Plot Regions
Axis Isolation
When the cursor is in the center of the plot, pan and zoom operates simultaneously on all the axes. It is often more intuitive to manipulate one axis at a time. To isolate an axis move the cursor towards the desired axis until it is highlighted.
Left/Right Y Axes:
Both the left and right y-axes can be isolated. Adjust the offset between left and right axes by isolating one side and panning up or down.
Time:
Date Selector
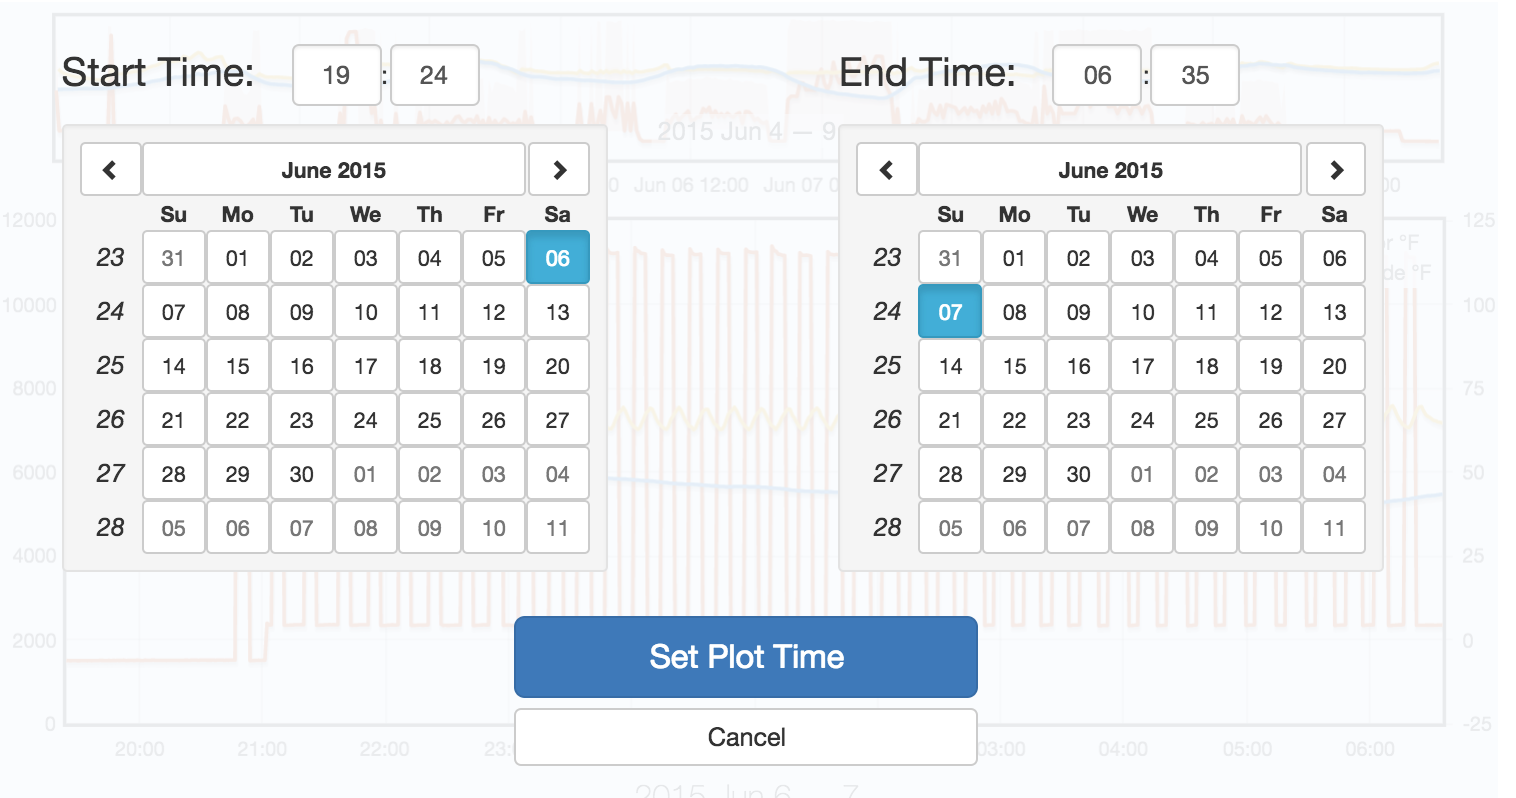
Open the date selector by clicking the date text below the Main Plot. The selector overlay allows you to specify exact time bounds for the Main Plot. The Navigation Plot is unaffected.
Plotting Errors
As you interact with the plot, you may encounter error messages like the following:
some data could not be retrieved
These errors may occur periodically due to a slow or unreliable connection with the remote installation. Pan or zoom the plot to retry the request. If an initial data request fails, the plot may zoom to an incorrect location. Use the autoscale buttons in the Tools Tab to recenter the plot.
some data cannot be displayed at this resolution
If a continuous or discrete element is not sufficiently decimated or if an event element has too many samples the plot data will be replaced with a thick line and an asterix will appear next to the legend entry. Once you have zoomed in sufficiently the data will reappear. To avoid this problem make sure the data stream is fully decimated, then refresh the installation database.
Control Panel
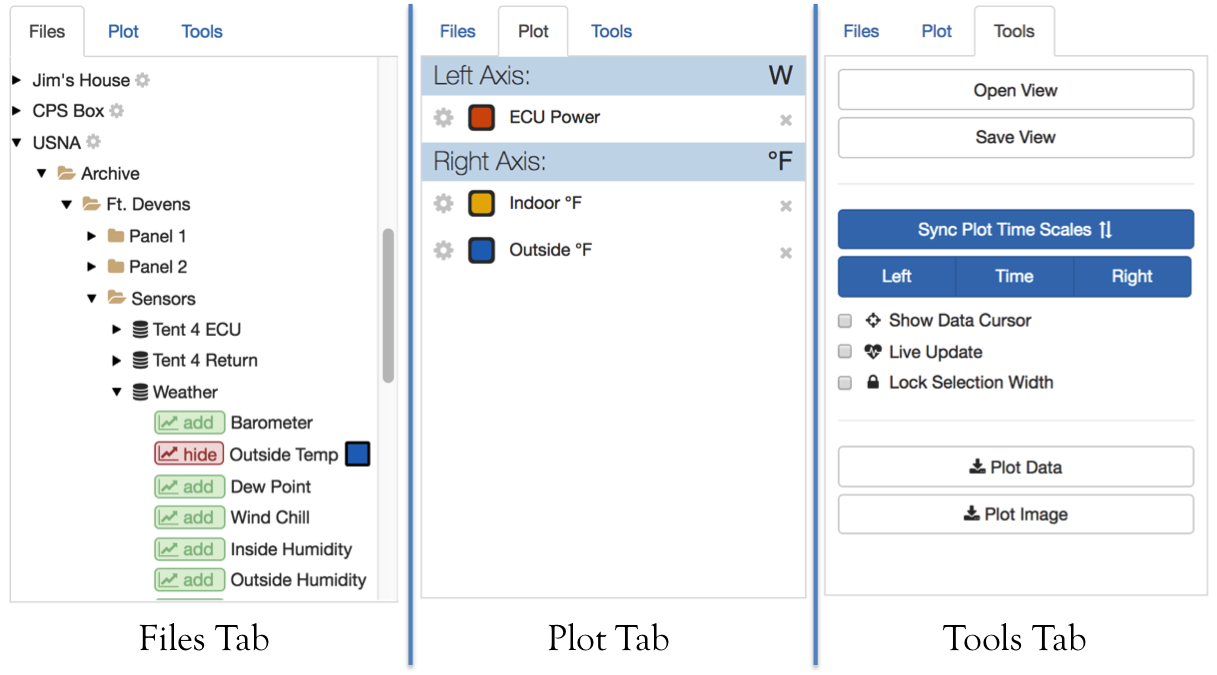
The control panel contains three tabs shown above. Use the Files Tab to select data to plot. Use the Plot Tab to see the currently plotted elements and customize the display. Use the Tools Tab to open and save views, download data, and adjust the plot behavior.
Files Tab
Each installation is an expandable file tree. Clicking the icon expands or collapses a node. Expand an installation to see the list of root folders. Folders contain data streams and/or subfolders. Expand a data stream to see the list of plottable elements. Add an element to the plot by clicking the button next to the element name. The plot color will appear as a square patch next to the name.
Remove an element by clicking the button. Elements may only be plotted on an axis with matching units. If both left and right axes have elements with other units, the plot button will be disabled. Hover the cursor over the button to display the required axis units.
If you have owner or administrator rights on an installation, click the icon next to the installation name to open the Installation Settings page.
Plot Tab
This tab displays the currently plotted elements organized by axis. The axis
headers show the current unit on the righthand side. Hover the cursor over an
element to display the element stream and installation. The format is
[stream_name] @ [installation_name].
Click the icon next to the element entry to remove it from the plot. When all elements are removed the Plot Tab is disabled.
Click the icon next to the element entry to bring up the Plot Settings Dialog shown below:
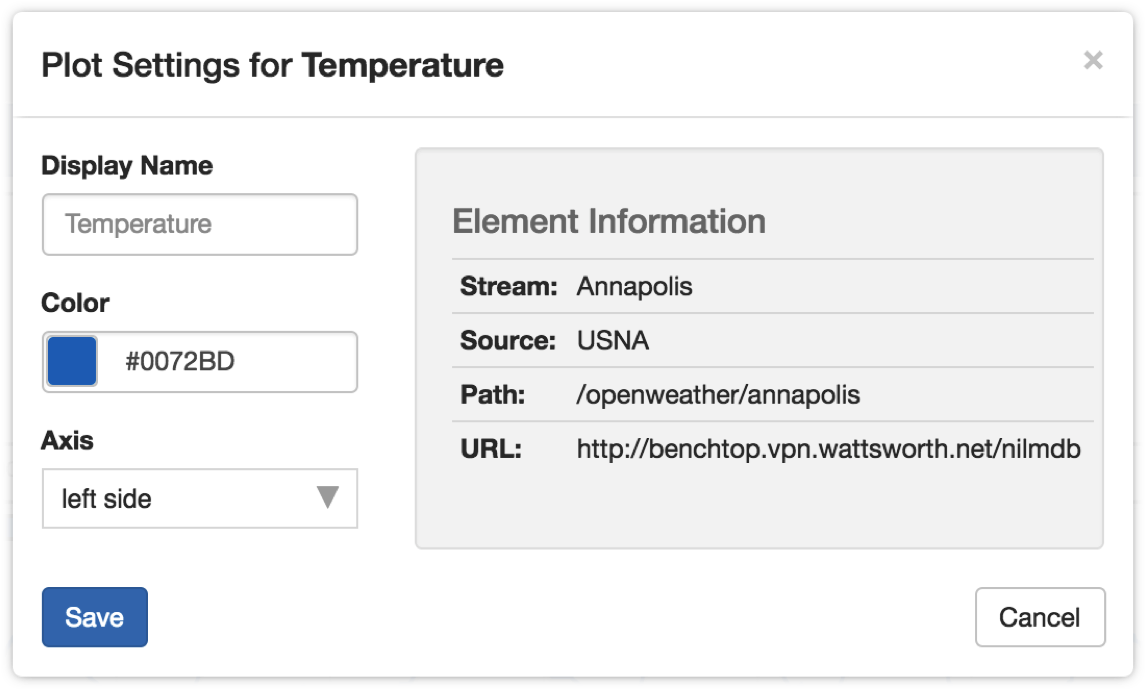
Customization options are on the left and element information is displayed on the right. The Path and URL refer to the NilmDB location where this data is stored. All customizations are local to the browser- they are not persisted to the database. Customization is available for:
| Option | Value | Description |
|---|---|---|
| Display Name | Text | The legend entry, leave empty to use the element name |
| Color | Hex | Click the color patch or type a custom value |
| Axis | Left, Right | Override default axis assignment (units must match) |
Tools Tab
This tab displays various plot control options as well as the Data Views and Download tools.
Autoscale Axes
These buttons adjust the time and y axis scales for the Main Plot and Navigation Plot.
| Button | Description |
|---|---|
| Sync Plot Time Scales | Rescale the Navigation Plot time axis to match the Main Plot |
| Left | Rescale the Main Plot left axis to fit the data |
| Time | Rescale the Main Plot time axis fit all the data |
| Right | Rescale the Main Plot right axis to fit the data |
Data Cursor
Display the plot value when the cursor is hovering over a datapoint in the Main Plot.
Live Update
When checked the plots are synced to the current time. The Navigation Plot displays the last hour and the Main Plot displays the last twenty minutes. If the plotted elements have no data over this interval the plots will be empty.
The plots automatically refresh to track the current time. To stop the auto refresh clear the checkbox or click the icon on the Live Update label at the bottom of the Main Plot.
Lock Selection Width
When checked the Navigation Plot selection is locked to a fixed width. Click and drag to pan the selection along the time axis.
When unchecked the Navigation Plot selection is variable width. Click and drag to scale the selection along the time axis.
Data Envelope
When checked the maximum and minimum bounds are displayed as shaded regions around the data mean. This shows the envelope of the data even though not all of the samples are available to plot.
When unchecked only the mean of the data is plotted. This setting does not affect plots where the resolution is high enough to show the raw samples.
Data Views
Data views are saved plots that can be shared between users. Users may only open views if they have permissions on all the datasets used in the view. The open/save buttons are located at the top of the Tools Tab.
Open View
Click Open View to display the Open View dialog. This dialog lists all available data views. If you do not see a view you are expecting check to make sure you have permissions on all the installations involved with the view.
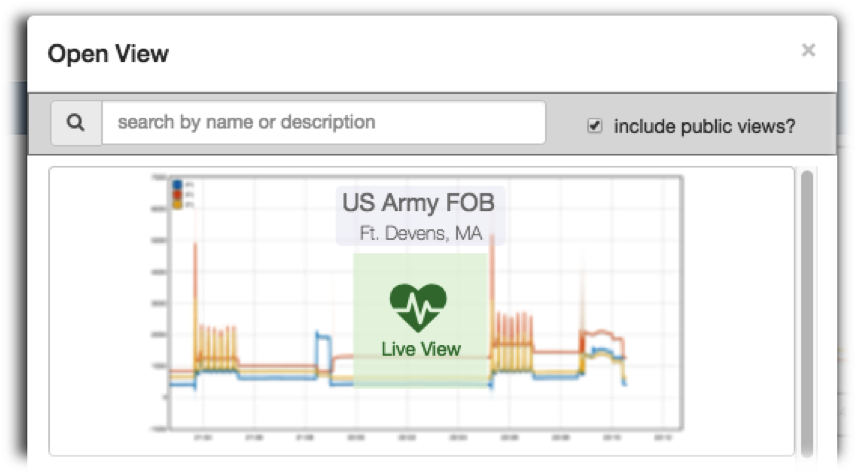
The search bar at the top of the dialog filters views by title and description. It updates as you type.
Clear the include public views? check box to show only the views you have created. Views that are locked to the current time have a Live Update label superimposed on the plot thumbnail. Click a thumbnail to load the view onto the plot. This will hide any currently plotted elements.
Save View
Click Save View to display the Save Current View dialog. This dialog allows you to save the current plot so you can reload it later. See the Download section for saving the plot data to your local computer.
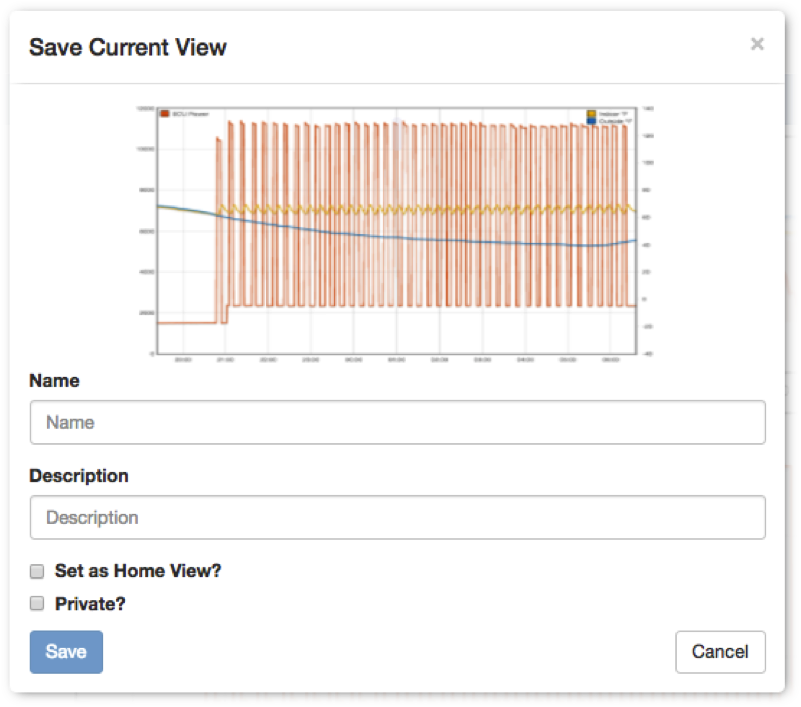
The Main Plot is used as the thumbnail image. The name is required and the description is optional.
Click Set as Home View? to automatically load this dataview when you open the website. This setting can be updated from the Account Page.
Click Private? to hide the view from other users. The view will always be hidden from users who do not have permission on the datasets regardless of the check box setting.
Download
You can download the plot image as a high resolution png file or download the datasets directly. The download tools are located in the Tools Tab.
Image
Click the Plot Image button to display a png image of the Main Plot. The picture resolution matches your display. To generate a higher resolution use the browser controls to zoom out on the web page before clicking the download button.
Data
Click the Plot Data button to display the Data Download Dialog shown below. Streams with plotted elements are listed along with details about the NilmDB location (URL and path).
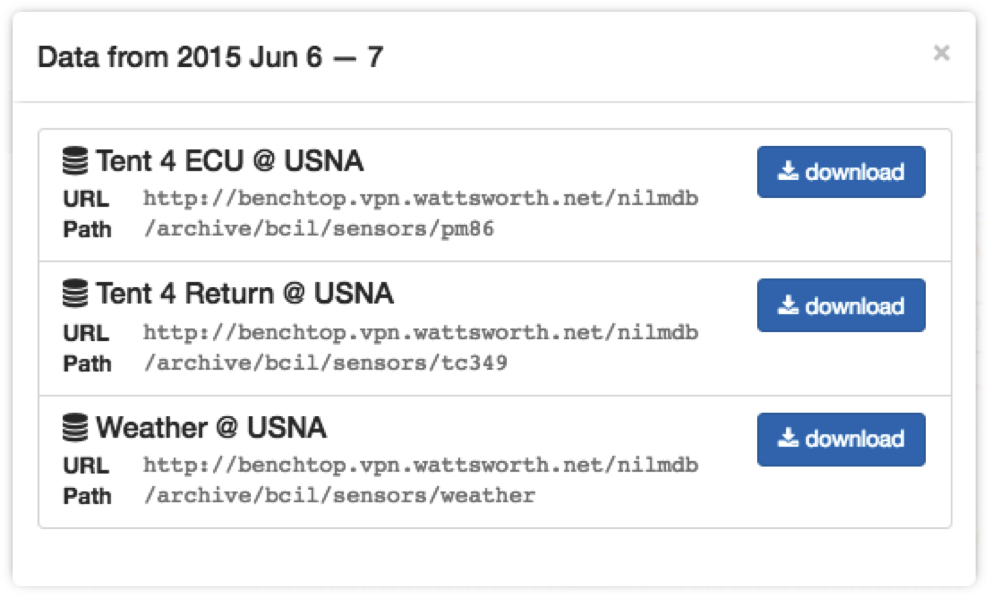
Click download to download the selected stream over the time
range displayed in the Main Plot. The data will be decimated to fit within
the maximum resolution of the host installation. For example if the
installation has a maximum resolution of 3000, the downloaded dataset will have
3000 points or less. The data format is designed to be loaded into MATLAB or
Excel. Instructions for loading the data into MATLAB are included in the file
header along with information about the data source, time range, and elements.
The file name referes to the selected date range as hhmm_DDMMYYYY__to__hhmm_DDMMYY.
Download Example: 0725_28Sep2010__to__0811_14Apr2020.txt:
###############################################
# Stream: Weather
# Installation: USNA (USNA Datasets)
# Path:   /archive/bcil/sensors/weather
# URL: http://benchtop.vpn.wattsworth.net/nilmdb
#
# start:             2010-09-28 07:25:29 -0400
# end:               2020-04-14 08:11:07 -0400
# total time:        over 9 years
# total rows:        1163
# decimation factor: 1024
# notes:
# legend:
#                    Column 1: time (us)
#                    Column 2: Barometer (none)
#                    Column 3: Outside Temp (°F)
#                    Column 4: Dew Point (none)
#                    Column 5: Wind Chill (none)
#                    Column 6: Inside Humidity (none)
#                    Column 7: Outside Humidity (none)
#
# --------- MATLAB INSTRUCTIONS ------------
#
# this file can be loaded directly into MATLAB
#
#   >> x = importdata('~/Downloads/filename.csv')
#   x =
#       data: [1737x15 double] % the data
#   textdata: {41x1 cell}      % this help text
#
# --------- NILMTOOL INSTRUCTIONS ----------
#
# raw data can be accessed using nilmtool, run:
#
# $> nilmtool -u http://benchtop.vpn.wattsworth.net/nilmdb extract -s @1285673129971000 -e @1586866267264000 /archive/bcil/sensors/weather
#
# ------------------------------------------
#
1322857034602538, 30.24609, 47.51152, 28.41116, 46.0334,  34.15723, 47.46582
1322867909921874, 30.31547, 43.41709, 30.82982, 42.68623, 38.76562,60.99707
1322878231684569, 30.39615, 40.28399, 28.69991, 39.25175, 40.0, 63.2002
...more data...